.png)
Cross Study: The efficiency of StoryFit and Kouo’s models in analysing and predicting audience reactions to screenplays and scripted content
The study illustrates how both StoryFit’s and Kouo’s models are able, from different modalities, to predict the rating of TV shows and highlight salient moments of interest and moments to improve.
Overview
The study illustrates how both StoryFit’s and Kouo’s models are able, from different modalities, to predict the rating of TV shows and highlight salient moments of interest and moments to improve. It was run as a comparative study, applying both methods to the pilot episodes of two TV shows and examining any differences or similarities in analysis. The experimental findings show that StoryFit’s and Kouo’s models can predict relative user engagement with shows. Furthermore, StoryFit and Kouo provide insights on specific scenes and segments relevant to the overall audience ratings of the shows, and we observed meaningful overlap in these features of interest across the two methodologies.
Introduction
The study’s objectives were to:
- Explore StoryFit’s ability to predict audience reactions from screenplay analysis data.
- Explore Kouo’s ability to predict audience reactions from physiological data collected during the viewing experience.
- Compare StoryFit’s and Kouo’s results and identify any overlaps in insights.
Designed as a parallel study, we applied both technologies to the two TV show pilots, Episode 1 of Clarice and Episode 1 of Killing Eve. StoryFit’s models were applied to the publicly available versions of the pilot scripts, while Kouo’s models ran on physiological data from Apple Watches recorded while the test subjects watched the episodes. At the end of each episode, test subjects filled out a short questionnaire to assess their sentiment towards the episode, the plot and the characters. Key findings We found that both StoryFit and Kouo predict relative viewer reception and give similar explanations for the result, down to the more granular, scene-by-scene insights, despite the different inputs for analysis.
Methods
Design
StoryFit’s models ran on publicly available versions of the pilot scripts, so they provided the analysis upfront. Kouo models ran on the physiological data of recruited participants who remotely shared their Apple Watch data while watching the episodes during a Zoom session, observed by an experimenter to ensure engagement*. As selection criteria, only individuals unfamiliar with the shows could participate in viewing sessions. The pilots were viewed back-to-back by each participant, with a break after each to re-set and answer questions on their willingness to keep watching the show in the future and their opinions on the plot and main characters. Given the length of each episode — circa 40 minutes — and to ensure that fatigue did not affect results, the viewing order was switched and tracked. A notable difference in the analysis was that the original scripts did not always precisely match the final edit of the pilot episodes on which Kouo’s models ran. Therefore, for the comparative analysis between StoryFit and Kouo, we focused solely on the largely unaltered sections, ignoring sections that were divergent from the scripts, which still accounted for about 55% of the episodes.
Procedure
For the entirety of the sessions, consisting of two 40-minute segments, study participants wore their smartwatches — Apple Watch — to provide physiological feedback. Each participant joined the sessions via Zoom from their home and was asked to find a comfortable place to watch the episodes and to maintain those conditions as much as possible during the experience. They also had to keep their webcams on to allow the experiment operator to ensure they remained engaged with the experience.
Variables: Show watched, Stress, Excitement, Focus.
Control: Order of show shown, whether viewers had already seen the shows, what setting they were watching the show in.
Results
Predicting user overall engagement
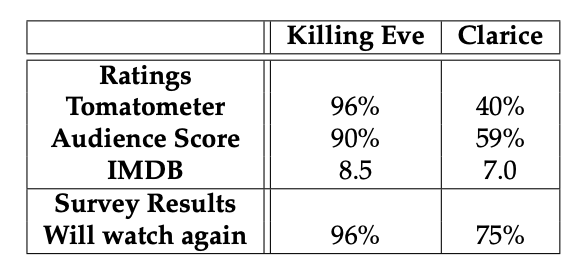
In Table 1, we show the Rotten Tomatoes** and IMDB** ratings for the two episodes and the summary of the survey responses of test subjects after watching the episodes. Killing Eve also scored much higher in ratings and survey responses, with experiment participants being about 30% more likely to continue watching Killing Eve, as reported in the bottom half of Table 1.
Comparing the two modalities, we noted several overlaps, reinforcing the validity of the observations. StoryFit observed that Killing Eve had twice as many emotionally intense scenes, as shown in Fig 1.

When measuring focus, excitement, and stress live in study participants, Kouo validated the finding.
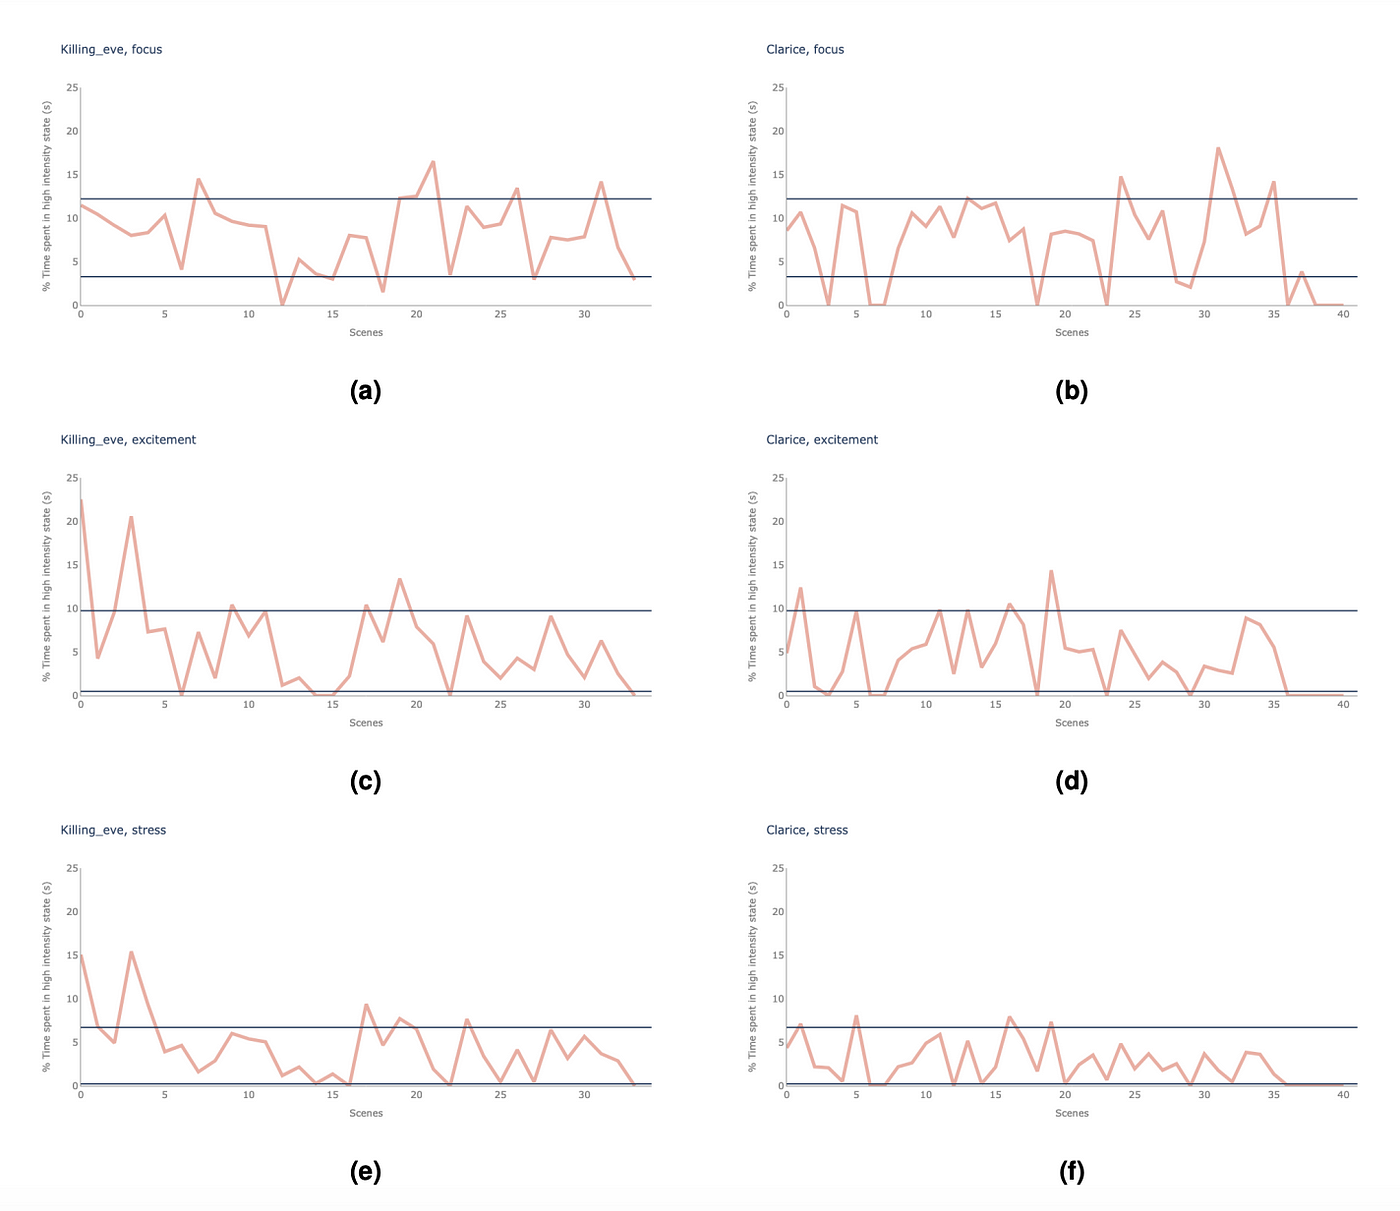
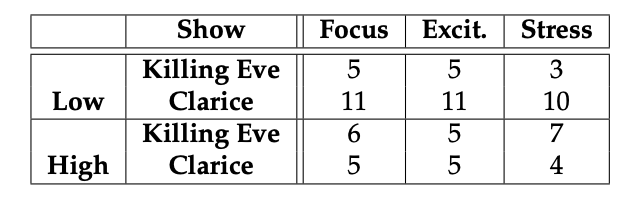
Fig 2 shows that, while moments of high emotional intensity are not reliably more for Killing Eve than Clarice, moments of low emotional intensity are reliably at least double for Clarice compared to Killing Eve across all recorded emotions. We report the details of these findings in Table 2.
Identifying crucial scenes and segments
StoryFit identifies several measures relevant to characterise a show. In particular, three measures correlated well, scene-by-scene, with Kouo extracted measures, reported in Fig. 3:
- Unimportant (correlation coefficient of 0.64) — these are moments StoryFit deemed unimportant to the overall show. These correlated well with moments of minimum detected intensity in focus. Notably, Killing Eve’s pilot has far fewer moments like these than Clarice.
- Argument (correlation coefficient of 0.57) — scenes in which StoryFit detected an argument correlate well with scenes where study participants showed an increased time spent in high-stress states, as measured by Kouo.
- Obstacles (correlation coefficient of 0.48) — scenes in which StoryFit deemed representing an obstacle in the plot correlate with scenes that Kouo detected having high time spent in high focus, albeit less strongly than the previous two measures.
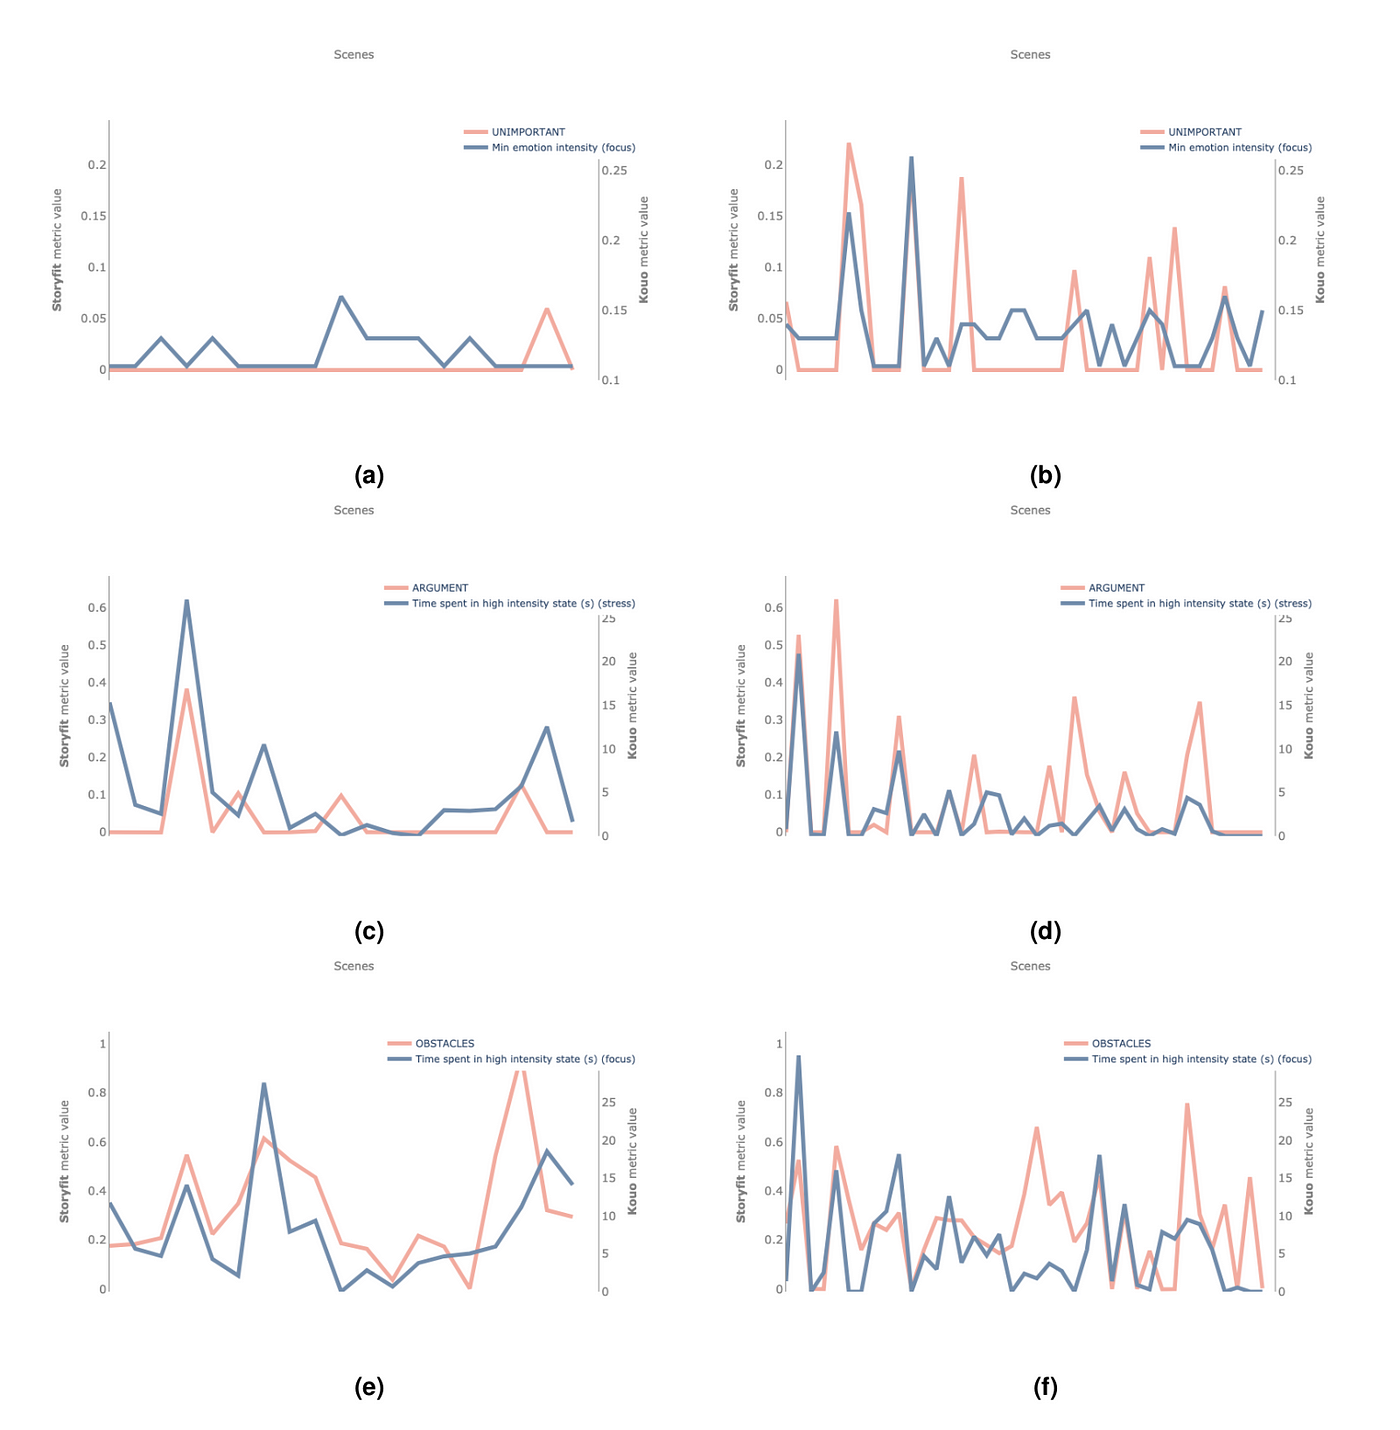
These correlation coefficients are especially meaningful because the models ran on two different inputs: StoryFit analysed the original script, and Kouo measured the emotional responses of test viewers watching the pilot episodes. Since the original script differs from the end product, often considerably (values of each show), we only considered scenes that haven’t meaningfully changed. Despite this, we observed high correlation, a testament to how StoryFit models reflect the end viewers’ emotional experiences when watching the show.
Conclusions
The study investigated whether StoryFit and Kouo could predict viewer reactions to scripted and recorded content such as TV shows and films. The results indicate that both companies use methods that infer audience preference and specific salient scenes. Each company, Kouo and StoryFit, helped identify that viewers found Clarice 50% less emotive than Killing Eve, also reflected in the difference in ratings for the two shows. Furthermore, on comparable scenes, the StoryFit and Kouo models had meaningfully correlated matches on insights identified, showing that StoryFit can identify insights reflective of the audience’s emotional reactions. We believe the tools are valuable diagnostic instruments to deploy early in the development phases of shows and films to predict audience reception and help ensure the relative success of content with it reducing production and postproduction costs. From this study, we can also conclude that StoryFit and Kouo are most effective when used together, as they sit perfectly across all stages of production. While StoryFit can successfully indicate the audience’s reception of a script before it goes into production, Kouo gives direct insights into audience responses to the content produced, reducing the cost attached to changes in post-production and forecasting the success of the finished product. All of these are vital for studios, streaming platforms and production companies.

